
What is a Gantt chart used for and when should you use one?
What is a Gantt chart used for and when should you use one?
Gantt charts are powerful tools for visualizing project timelines, tracking progress, and managing tasks. They provide a clear, visual overview of what needs to be done, by whom, and when, making them essential for teams managing complex projects.
Here’s how and when to use Gantt charts effectively:
Breaking down and managing complex projects
Gantt charts help break down large projects into smaller, manageable tasks. By scheduling tasks on a timeline with details like start and end dates, assignees, milestones, and dependencies, teams can easily see the entire project’s structure. This approach helps keep everyone aligned on priorities and timelines, from planning a marketing campaign to coordinating a product launch.
Breaking down and managing complex projects
One of the standout features of a Gantt chart is its ability to show task dependencies — the relationships between tasks that affect the project’s flow. For example, if Task B cannot start until Task A is completed, the Gantt chart will visually represent this dependency.
This is crucial for managing logistics in multi-team environments, where delays in one area can impact several other tasks. By visualizing these connections, teams can prevent bottlenecks and keep projects on track.
Tracking project progress and adjusting plans
Gantt charts are not just planning tools — they’re also valuable for monitoring progress in real time. As tasks are completed and logged, project managers can quickly assess the project’s health against planned schedules. Visual indicators like release dates, milestones, and completion percentages allow teams to identify potential delays early, adjust workflows, and ensure that projects stay on course.
Coordinating across teams and managing resources
Gantt charts serve as a single source of truth for teams working on multi-phase or multi-team projects. They provide a clear overview of timelines, responsibilities, and objectives, making it easier to coordinate efforts and manage resources efficiently. With a Gantt chart, managers can allocate the right people to the right tasks and adjust as project needs change.
Supporting Work Breakdown Structures (WBS)
Gantt charts work well with a Work Breakdown Structures (WBS), which decompose large goals into smaller, more manageable objectives. While a WBS outlines the scope of work, integrating it with a Gantt chart adds timelines, ownership, and dependencies, creating a comprehensive project plan that drives project success.
What are the components of a Gantt chart?
While every team’s project Gantt chart will look different depending on their unique workflow and critical path, there are six major components that are important to include:
- Dates/times: Gantt charts show task dates from beginning to end as well as their place on the overall project timeline to enable easier planning.
- Tasks and task bars: Tasks and sub-tasks are shown in order of what needs to be completed. Tasks are organized vertically on the left, with bars representing each task shown as a visual bar on a timeline to better view task dependencies over a project’s lifetime.
- Milestones and progress: Certain points of a project are represented as milestones, which on a Gantt chart can look like tasks with a distinct marker. Progress is tracked in relation to how close each phase is to its corresponding milestone, sometimes showing a completion percentage of an ongoing task.
- Dependencies: Arrows or lines are used to denote which tasks are dependent on each other.
- Vertical line markers: Vertical markers indicate the current data of a project on the chart, helping you see where your project is at and how much work is left to do.
- Resources: Some tasks will include resources such as tools, documents, or contacts that are helpful in completing a task.
Who uses Gantt charts?
Gantt charts are versatile tools that are widely used by teams and professionals across various industries. From project managers and team leads to marketers and operations specialists, anyone looking to keep their projects on track can benefit from Gantt charts. They help:
- Project managers plan, schedule, and assign tasks, ensuring everyone is aligned and aware of dependent tasks and deadlines.
- Marketing teams coordinate campaigns, manage resources, and track progress across multiple channels — from social media to content creation.
- Product development teams visualize product roadmaps, track release timelines, and manage cross-functional workflows to bring products to market faster.
- Construction managers outline project phases, track deliverables, and manage subcontractors, ensuring projects are completed on time and within budget.
- Event planners map out every detail from logistics to marketing, coordinating with vendors and stakeholders to deliver successful events.
- Retail teams manage store openings, promotions, and inventory planning, ensuring all activities are synchronized for maximum impact.
- Media and production teams organize content calendars, coordinate shoots, and manage post-production schedules to ensure deadlines are met and content is delivered on time.
No matter the field, Gantt charts provide a clear, visual way to manage complex projects and keep teams moving in the right direction.
Gantt chart examples
Gantt charts are incredibly adaptable and can be used in various industries to bring clarity, organization, and efficiency to complex projects. Let’s explore how different industries use Gantt charts to streamline their workflows and achieve their goals.
How retail companies can utilize Gantt charts
Retail companies often juggle multiple projects at once, from planning new store openings and seasonal promotions to managing inventory and visual merchandising. Gantt charts offer a clear, visual way to manage these overlapping tasks, helping retail teams streamline their workflows and hit their targets.
Use case: For launching a new store, a Gantt chart can break down every phase of the project — from securing permits and organizing inventory to training staff and rolling out marketing campaigns. Each task is plotted on a timeline, showing its start and end date, dependencies, and who is responsible.
Benefits: With a Gantt chart, retail teams can ensure tasks are completed on schedule, manage dependencies effectively, and allocate resources where they’re needed most. This level of organization keeps everyone aligned, from store managers to marketing teams, and helps prevent delays — ensuring a smooth and successful store launch.
How media teams can optimize workflows with Gantt charts
Media and production teams thrive on tight schedules, fast turnarounds, and multi-layered content calendars. Gantt charts help these teams stay on top of every phase of production, from brainstorming and scripting to shooting, editing, and distribution.
Use case: For a multimedia campaign, a Gantt chart can be used to outline all tasks, such as scriptwriting, filming, post-production, and channel-specific content distribution. This structured view allows for real-time adjustments and efficient task management.
Benefits: By using Gantt charts, media teams can instantly see where each piece of content stands in the production process, identify potential bottlenecks, and adjust schedules as needed. This not only ensures timely delivery but also reduces the risk of costly delays and helps keep the entire team in sync.
How construction projects benefit from Gantt charts
Construction projects are often complex, involving numerous stakeholders, detailed planning, and strict deadlines. Gantt charts provide construction managers with a comprehensive overview of all project phases, from site preparation to the final handover, helping them manage resources and timelines effectively.
Use case: For a commercial building project, a Gantt chart can outline tasks from pre-production to post-production, including design approvals, foundation work, structural development, and finishing touches. Each task is clearly defined with its duration and dependencies, providing a visual roadmap for the entire project.
Benefits: Gantt charts give construction managers the visibility needed to allocate resources efficiently, manage subcontractors, and monitor progress against deadlines. This helps prevent delays, manage risks proactively, and ensure that the project stays within budget and scope, leading to successful project completion.
How to create a Gantt chart
Creating a Gantt chart from scratch requires several steps, from gathering all the different tasks and subtasks to defining dependencies, and creating a horizontal timeline. While this can be done independently, it’s a lot easier to start with the help of a project management platform with built-in Gantt chart views and templates, like monday work management.
Step 1: Define your project scope and tasks
Before diving into your Gantt chart, start by outlining the entire scope of your project. Identify all the major tasks and subtasks that need to be accomplished to complete the project. Think of each phase of the project and break it down into smaller, actionable steps.
Step 2: Establish task durations and deadlines
Once you have a clear project task list, determine how long each task will take to complete. Assign start and end dates for each task based on the project timeline. This helps in setting realistic deadlines and planning resources effectively.
Step 3: Identify task dependencies
Tasks in a project are often interconnected. Use your Gantt chart to visualize which tasks depend on others. For example, task B cannot start until task A is complete. Identifying these dependencies is crucial for a smooth workflow and helps prevent bottlenecks later.
Step 4: Allocate resources and assign task owners
Determine who will be responsible for each task. Assigning task owners helps establish accountability, ensures everyone knows their role, and provides a clear view for more efficient resource management. In monday work management, you can easily assign team members to tasks directly on your Gantt chart, making it clear who is responsible for what.
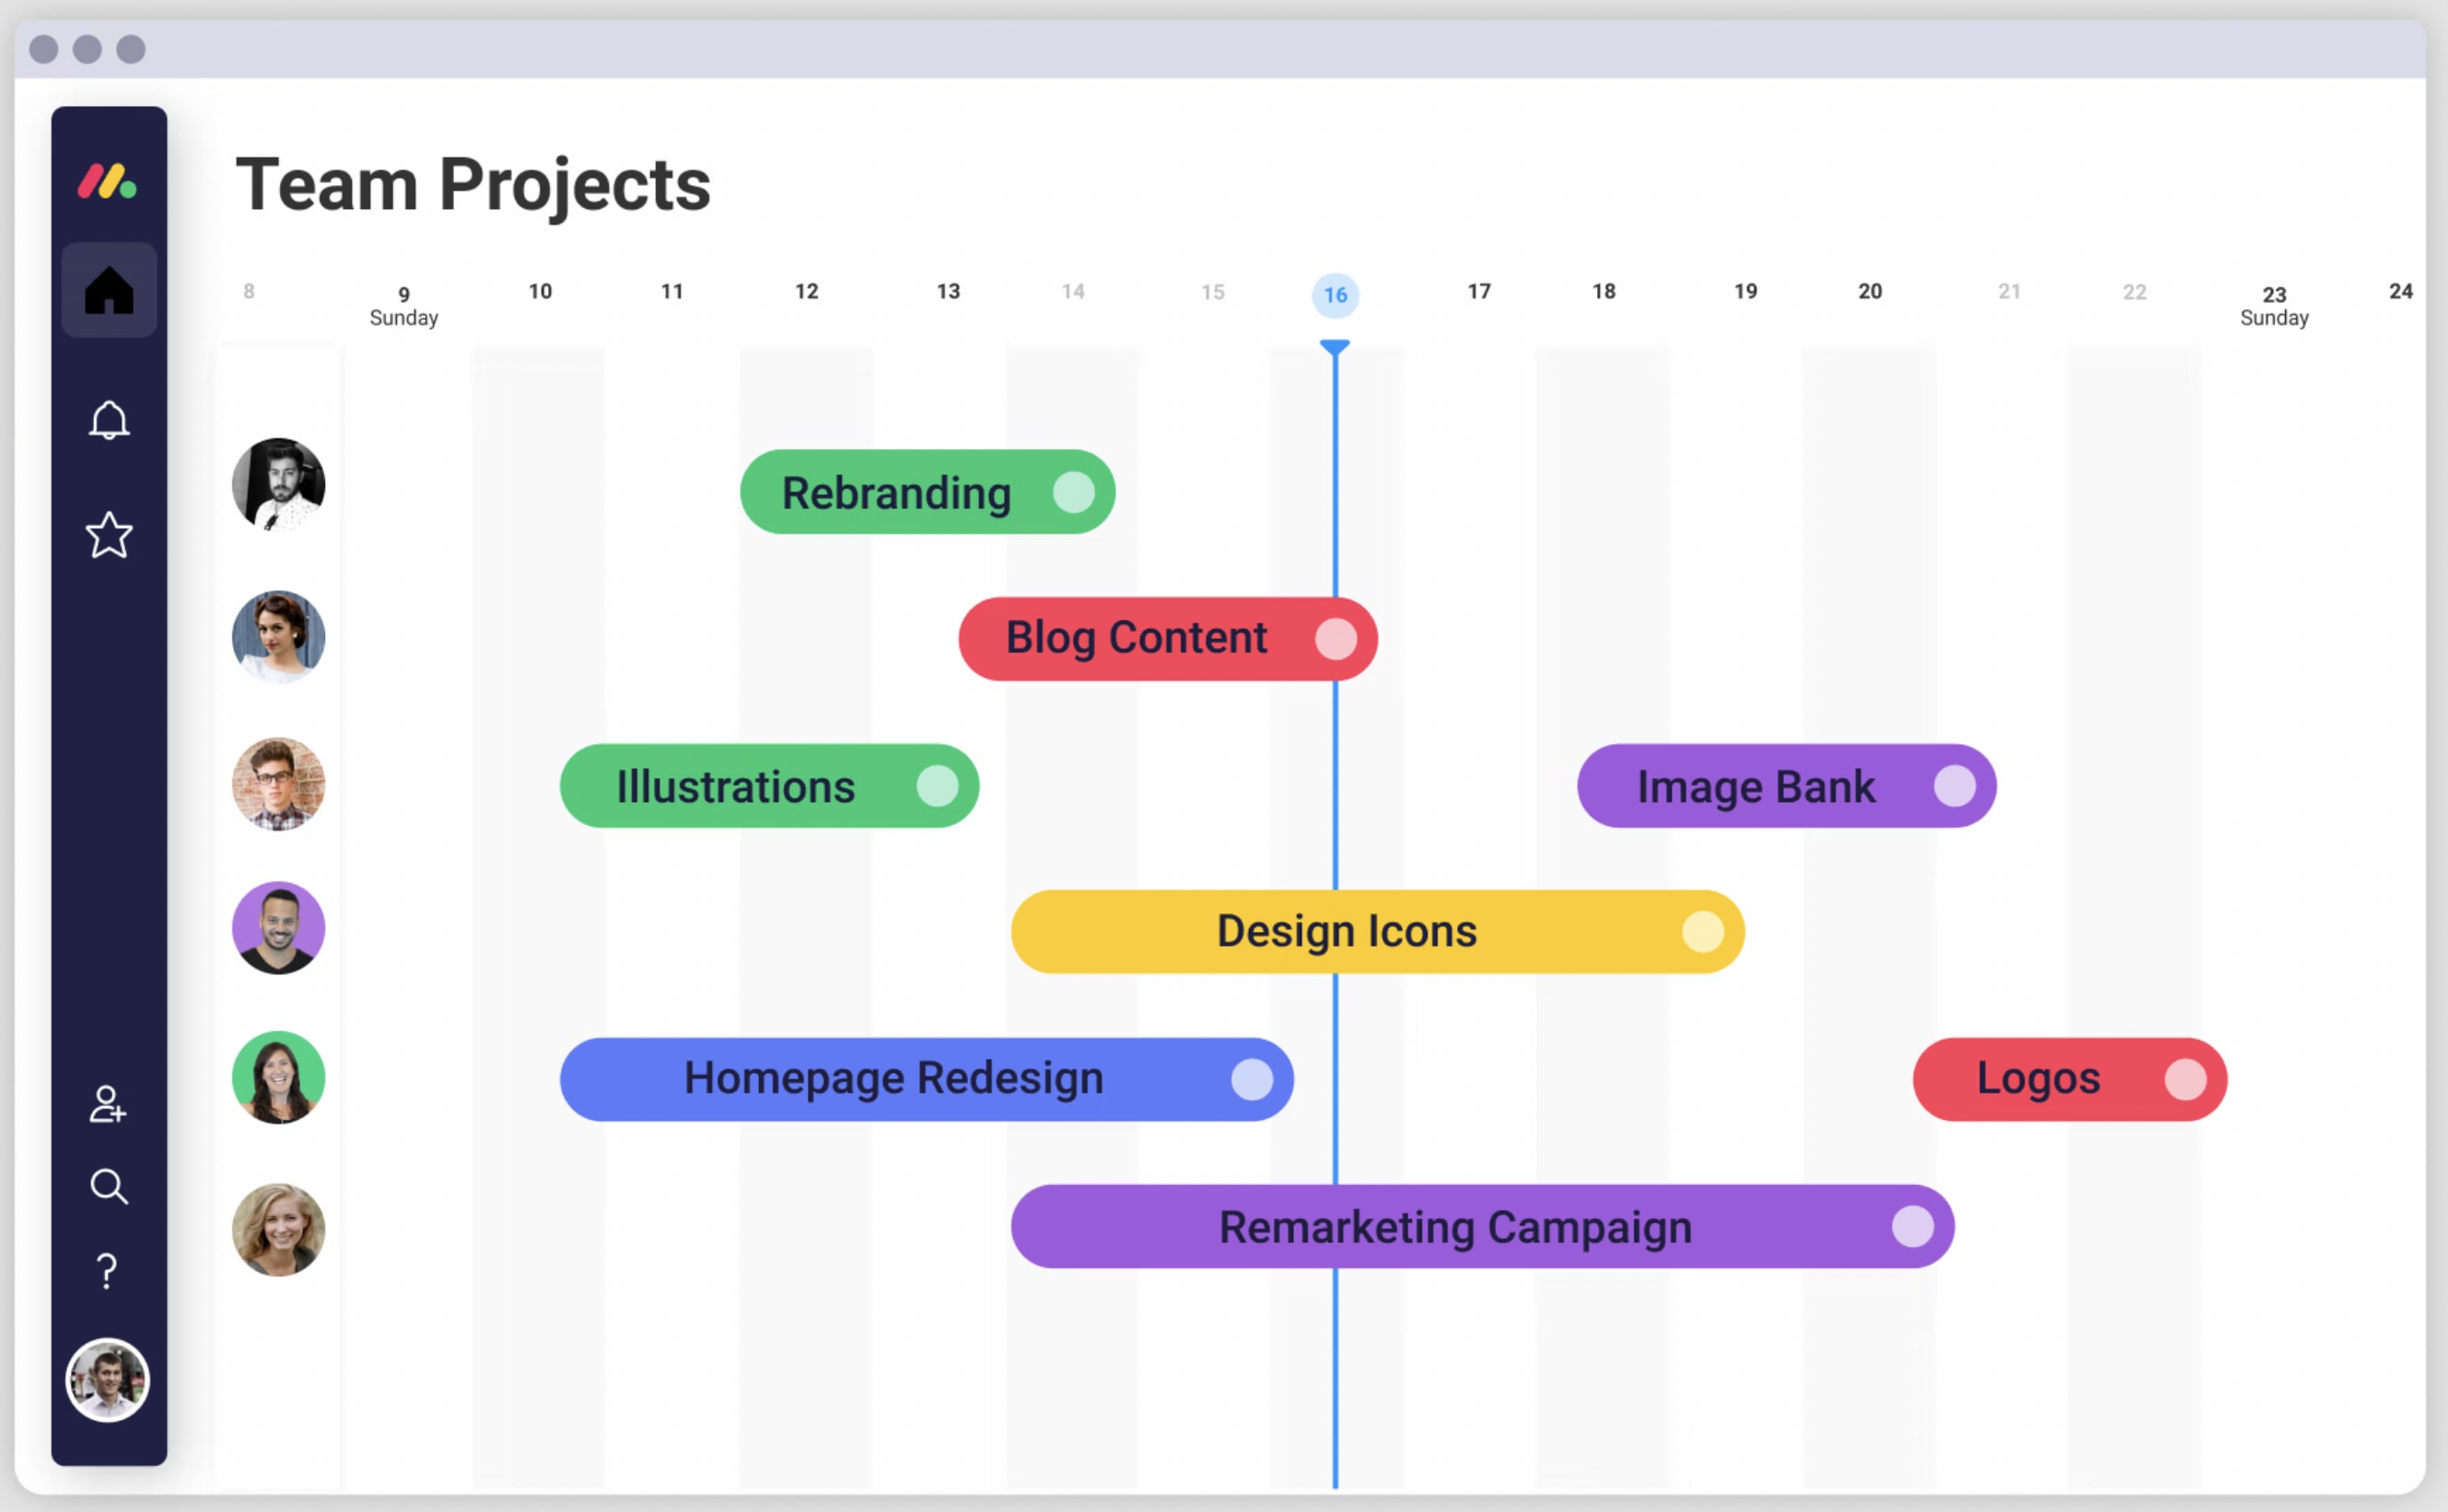
Step 5: Build your Gantt chart timeline
Now that you have all the information ready, it’s time to visualize it. Use monday work management to create your Gantt chart with just a few clicks. Start by adding your tasks, setting durations, and linking dependencies. You’ll see your project timeline take shape, providing a clear, visual overview.
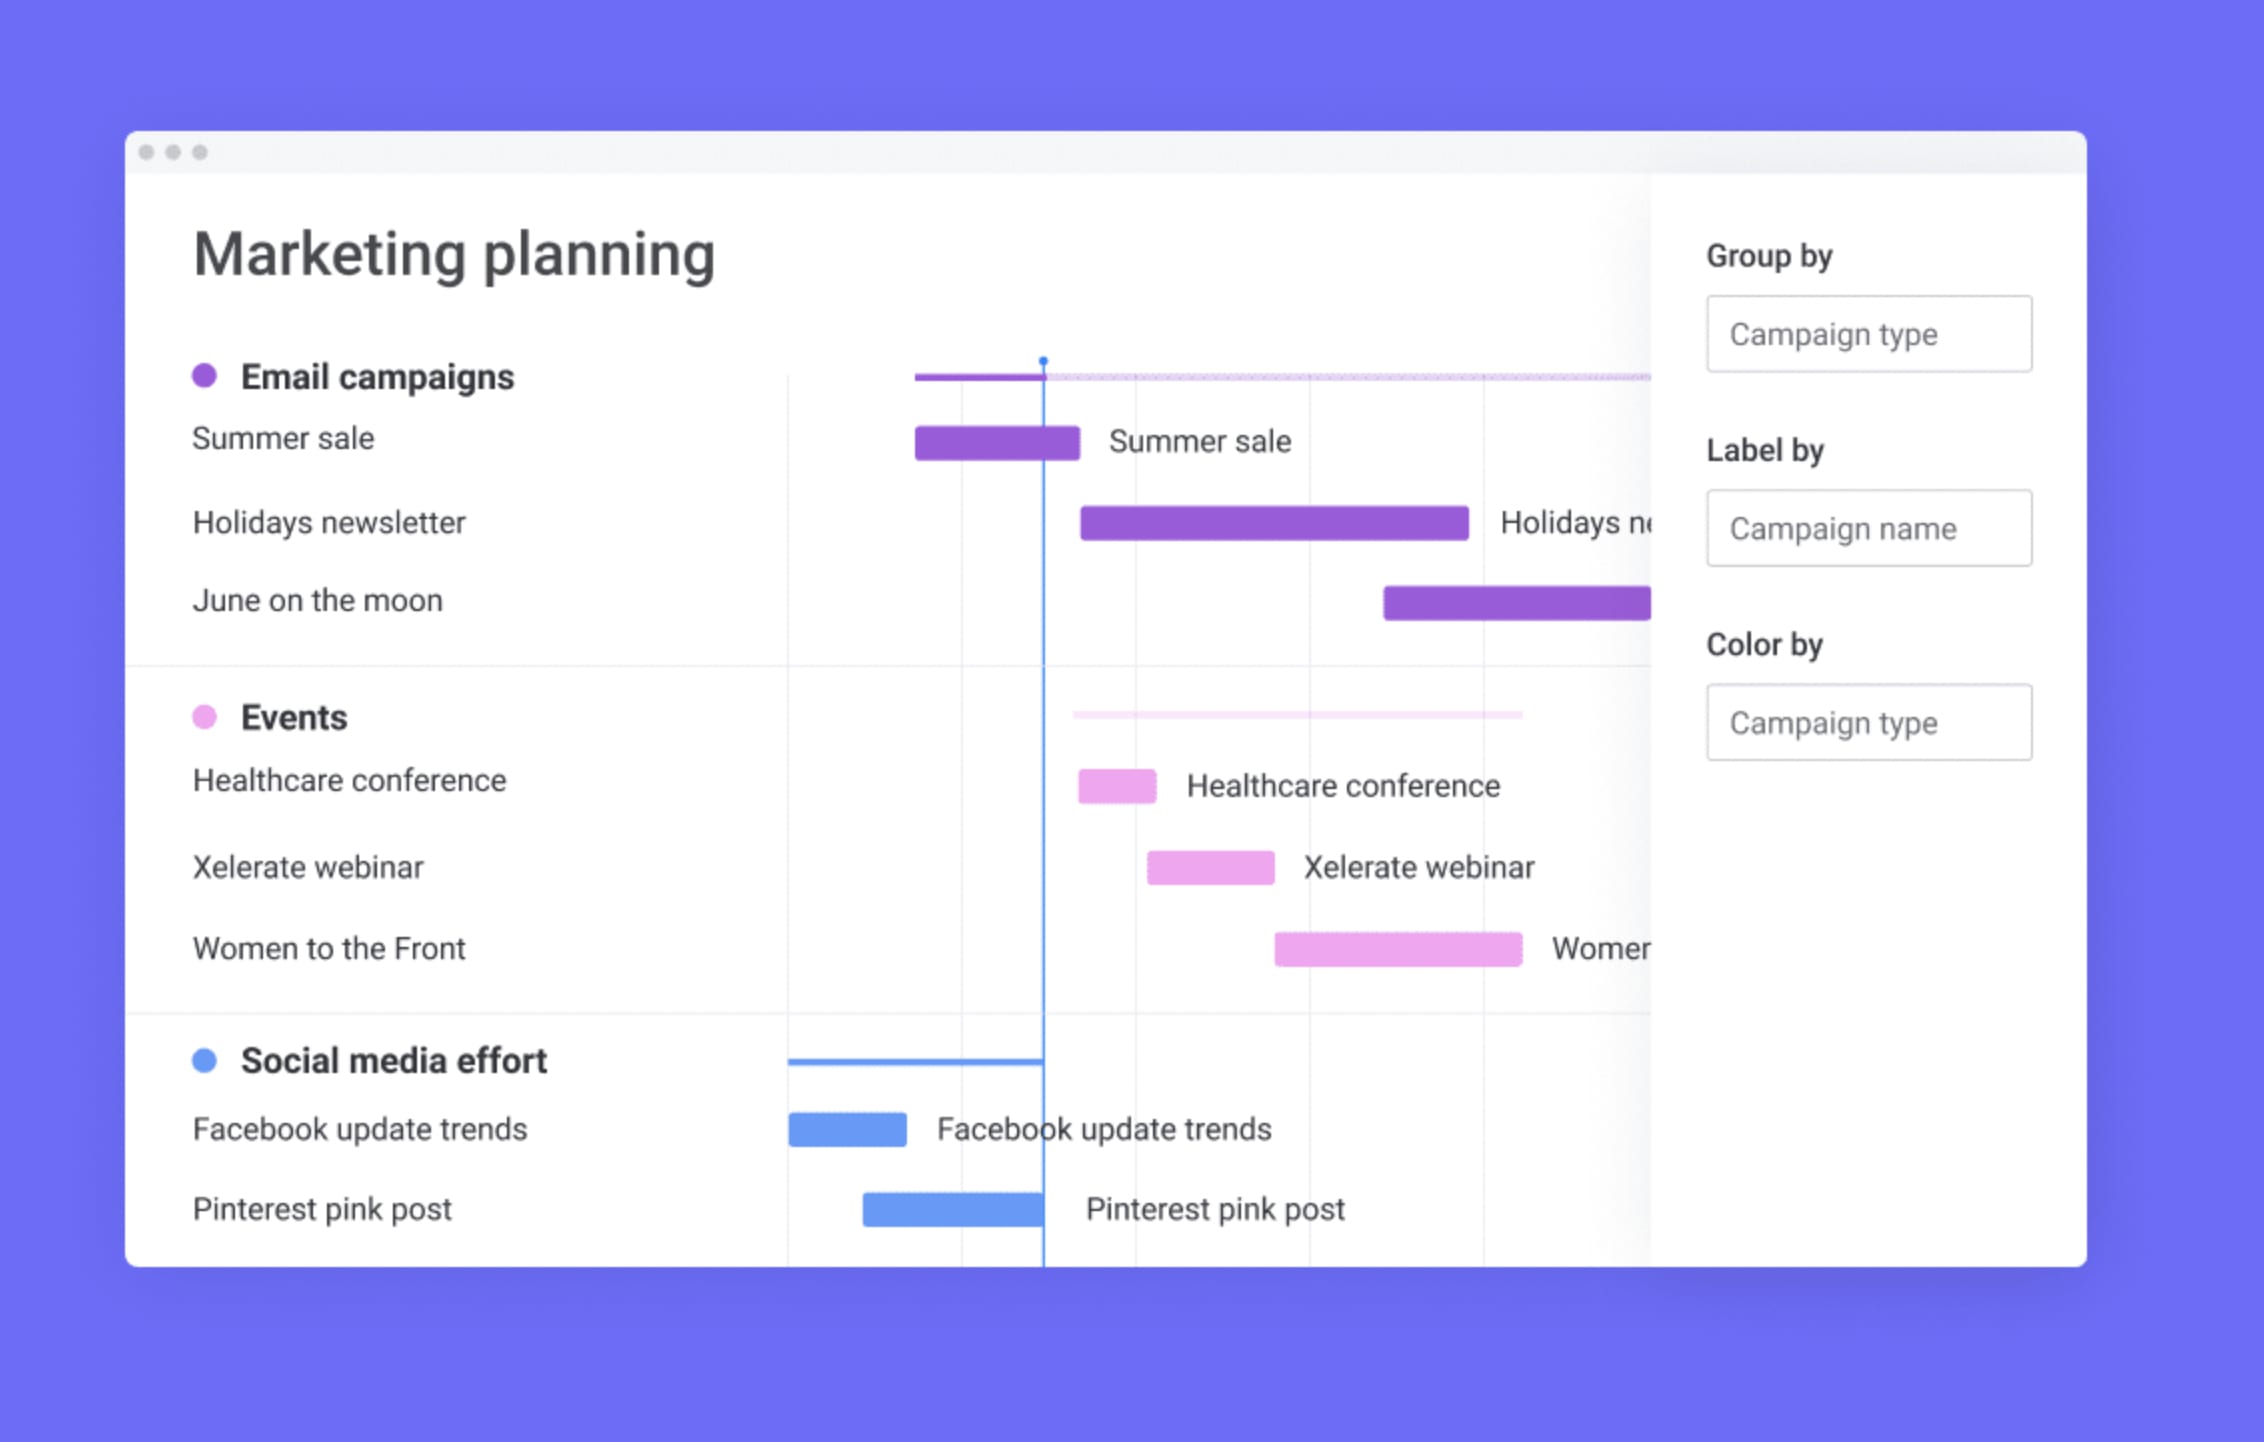
Step 6: Customize your Gantt chart view
Every project is unique, so customize your Gantt chart to fit your team’s needs. Use colors, labels, and filters to highlight important milestones, deadlines, or critical paths. With monday work management, you can add widgets to your dashboard for a high-level overview or zoom into specific tasks for more detail.
Step 7: Monitor progress and make adjustments
A Gantt chart is a living document that needs to be updated as your project progresses. Track task completion, monitor timelines, and adjust as needed if deadlines shift or new tasks arise. With monday work management, updates are easy — you can make changes directly on your Gantt chart, keeping everyone on the same page.
Step 8: Share your Gantt chart with stakeholders
Finally, share your Gantt chart with team members, clients, or stakeholders to keep everyone informed and aligned. monday work management allows you to easily share your Gantt chart views and customize what each viewer can see, ensuring the right level of transparency and collaboration.
How to view your tasks on a Gantt chart with monday work management
monday work management offers over 27 project views to view your tasks, with a Gantt chart being one of them. That means that instead of creating the chart from scratch, all you need to do is create your workboard, including all the parameters you’d like such as columns and automations, and then in a few clicks, you can view it as a Gantt chart. Here’s how it works:
- Make sure your board has a Timeline Column and Dependency Column.
- In the Board View menu, select Gantt
- Your tasks are now organized in one Gantt chart and you can get more creative with on-the-fly edits and cool features like The Gantt Baseline, which allows you to visualize your current project’s progression against the planned timeline
Once your Gantt view is created in monday work management, you can then customize it to your liking. You can add it as a widget to your dashboard so it’s easily accessible, customize which columns from your board appear in your chart, and view items in your chart by group such as project phases. You can also play with visual settings by adding labels or specific colors to items on your chart.